Photos | Data Visualization on Computer Monitor
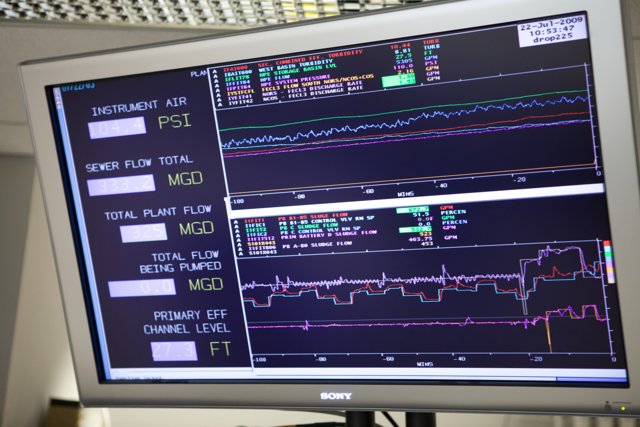
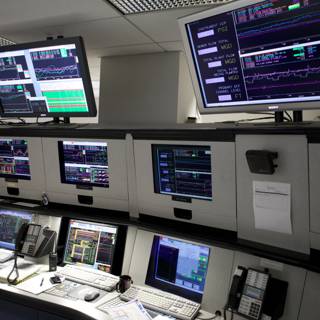
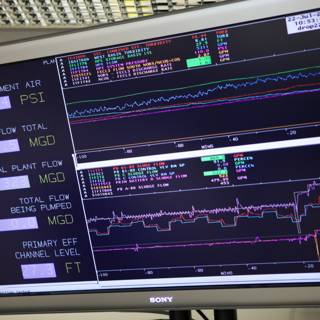
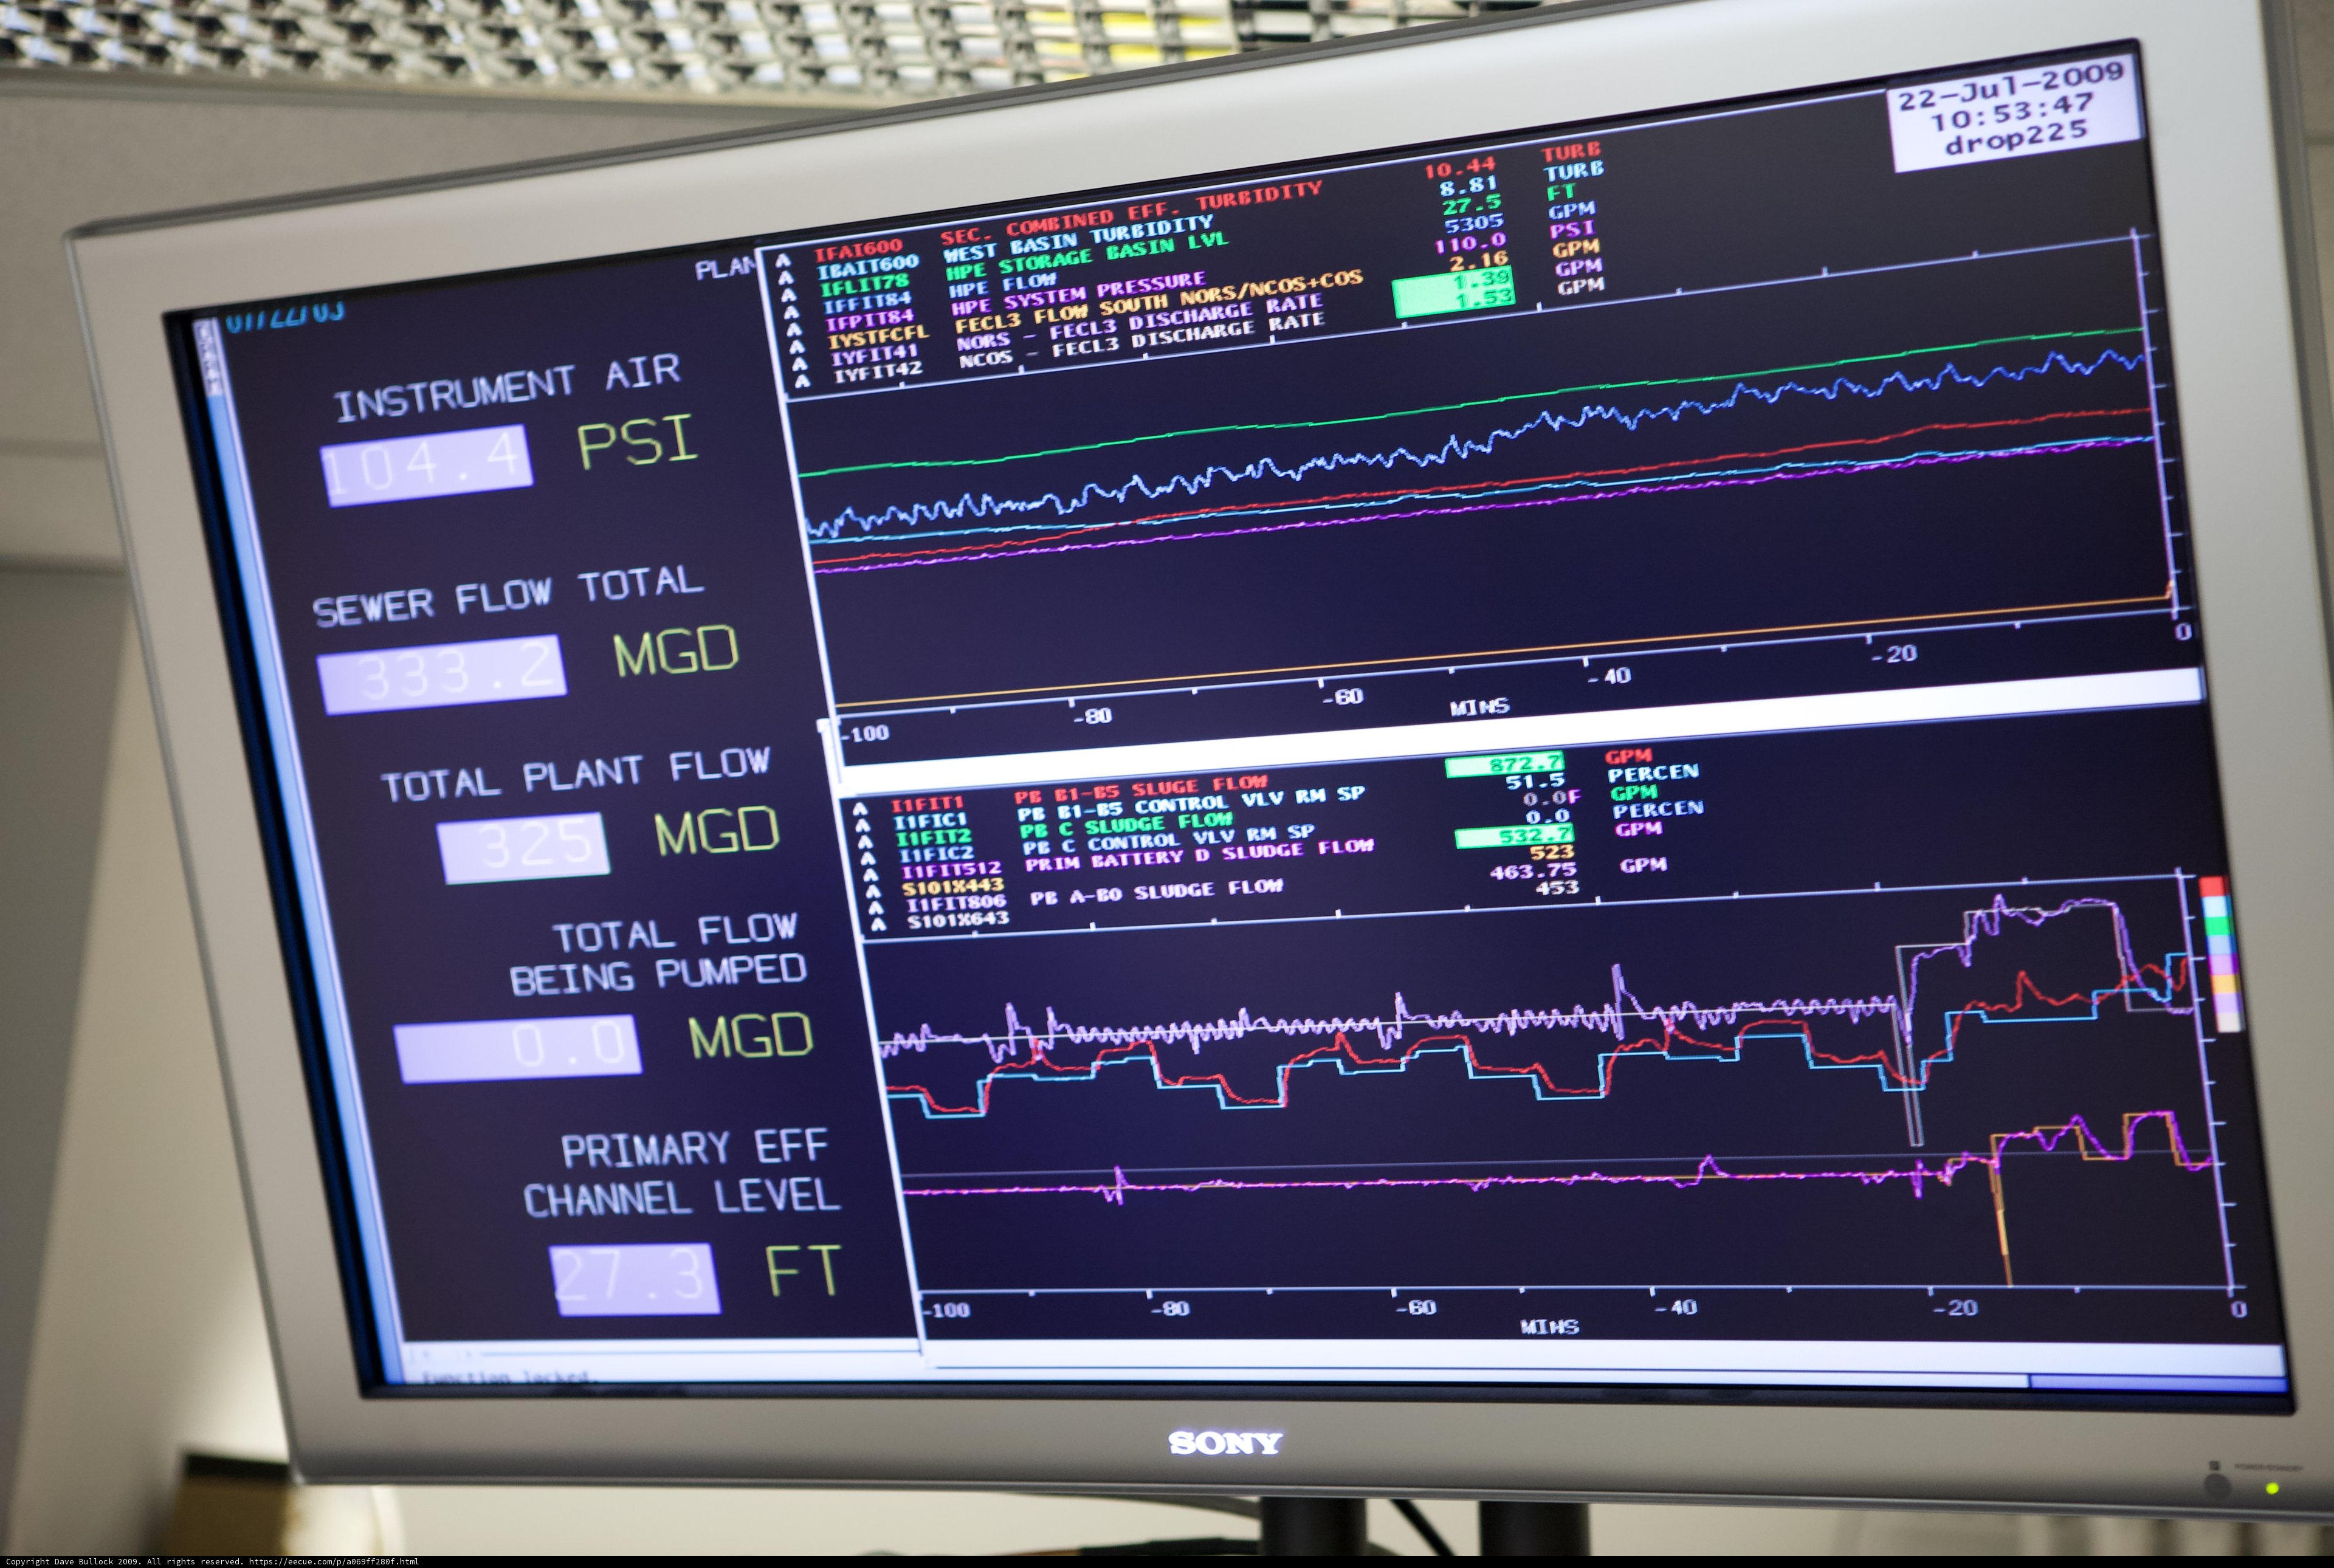
A close-up view of a computer monitor displaying a graph of data. The electronic document is part of the 2009 Hyperion album showcasing advancements in computer hardware and consumer electronics.
BLIP-2 Description:
a computer monitor with a graph on itChronologically Adjacent
Note: You can also navigate with your arrow keys or swiping.
Metadata
Capture date:
Original Dimensions:
5616w x 3744h - (download 4k)
Usage
Dominant Color:
flon bo battery control plant hyperion channel mins monitor electronics pumped turbidity flow panel display air pe hest chart plan pressure flat hardware rate es sluge psi discharge level instrument screen led-backlit lcd display computer basin combined percen sludge south ture total nors sp mgd machine system flom document consumer electronics eff primary sony sewer storage sec prim
Detected Text
0.0 04 10 10.44 100 101 101x643 110.0 11f11512 2.16 20 2009 22 27 32.7 325 333 40 443 453 463.75 47 5 51 523 53 5305 8.81 80 air b1 basin battery bo channel combined d discharge eff es fecl3 flom flon hest instrument ju1 mgd mins nors percen plan prim primary rate sludge sluge sony sp sewer south storage turbidity ture total a being control drop225 flow level pe plant pressure psi pumped sec system
iso
1600
metering mode
5
aperture
f/2.8
focal length
70mm
shutter speed
1/30s
camera make
Canon
camera model
lens model
overall
(19.86%)
curation
(25.00%)
highlight visibility
(1.99%)
behavioral
(10.12%)
failure
(-0.44%)
harmonious color
(-1.12%)
immersiveness
(0.17%)
interaction
(1.00%)
interesting subject
(-78.42%)
intrusive object presence
(-17.24%)
lively color
(16.55%)
low light
(0.63%)
noise
(-0.88%)
pleasant camera tilt
(-8.26%)
pleasant composition
(-18.73%)
pleasant lighting
(-15.67%)
pleasant pattern
(6.20%)
pleasant perspective
(9.98%)
pleasant post processing
(2.18%)
pleasant reflection
(-2.01%)
pleasant symmetry
(4.52%)
sharply focused subject
(5.64%)
tastefully blurred
(11.77%)
well chosen subject
(-9.03%)
well framed subject
(53.96%)
well timed shot
(-1.96%)
all
(1.05%)
* WARNING: The title and caption of this image were generated with AI (gpt-3.5-turbo-0301
from
OpenAI) based on a
BLIP-2 image-to-text labeling, tags,
location,
people
and album metadata from the image and are
potentially inaccurate, often hilariously so. If you'd like me to adjust anything,
just reach out.