Photos | Analyzing Data Trends

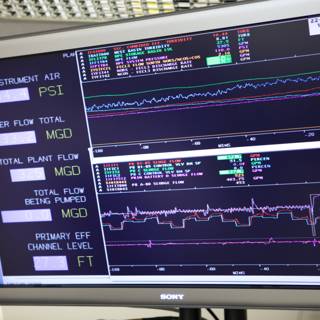
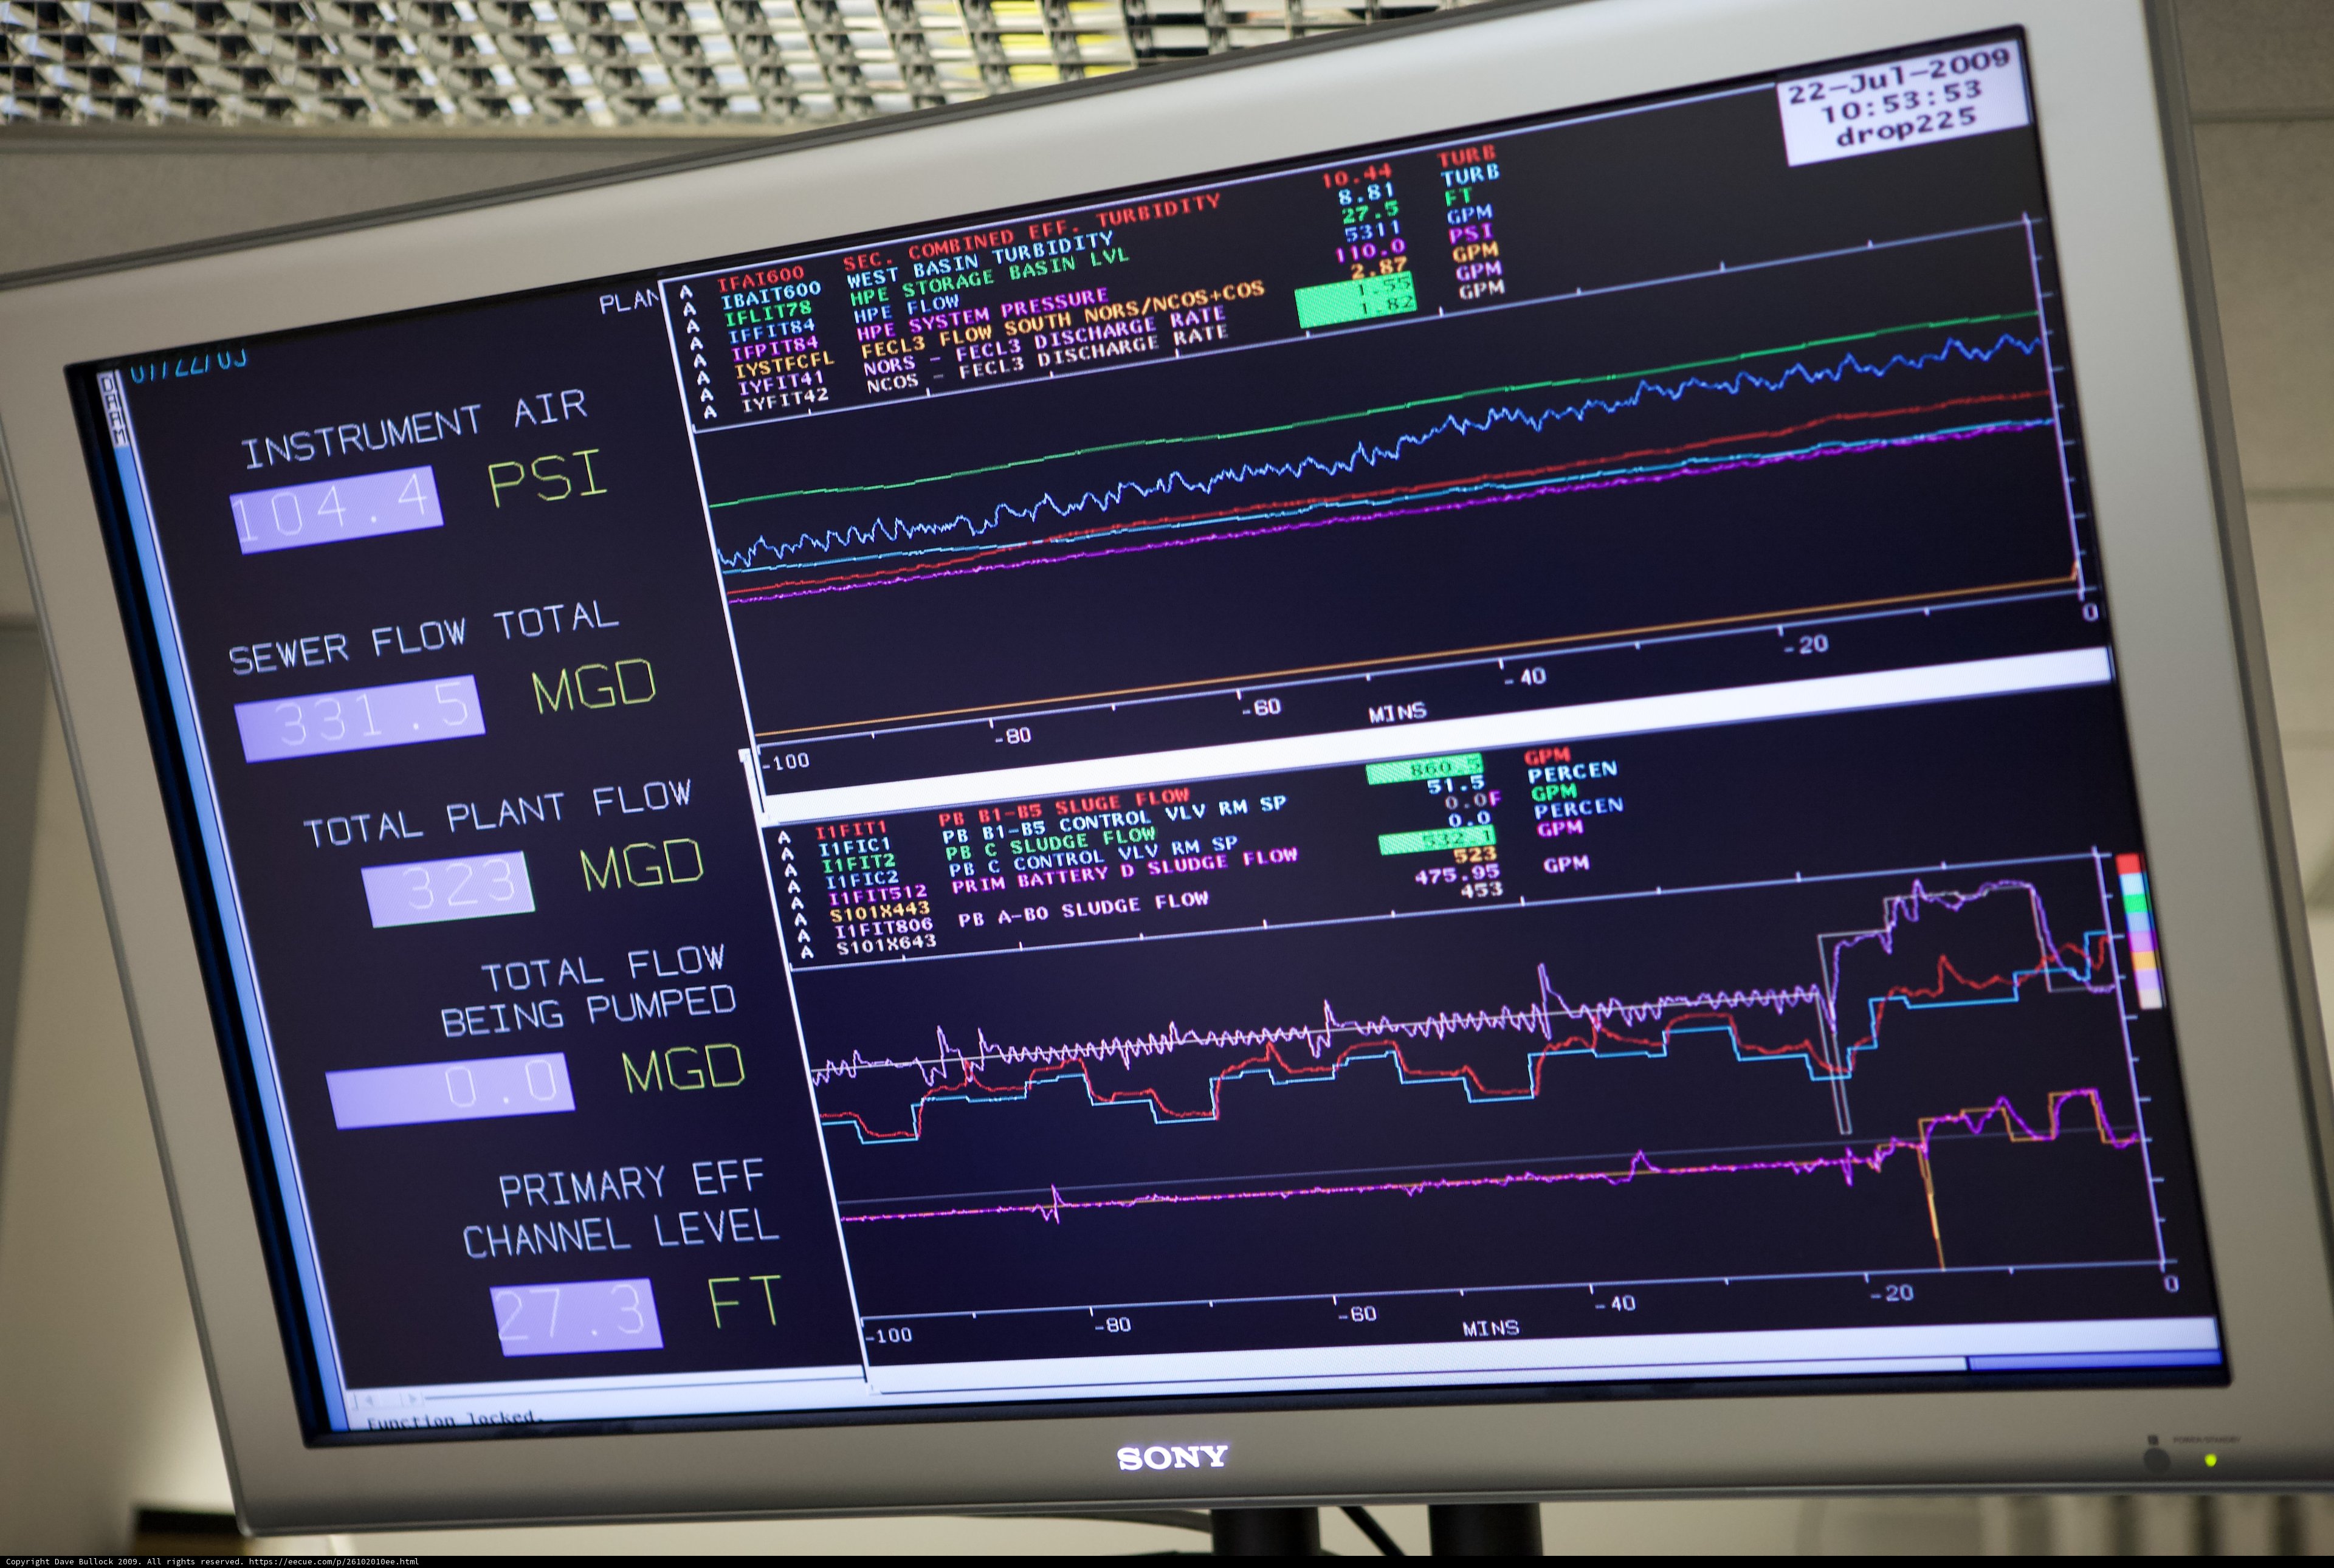
This computer monitor displays a detailed graph, providing insights into data trends and analysis in 2009. #chart #computer #technology #dataanalysis
BLIP-2 Description:
a computer monitor with a graph on itChronologically Adjacent
Note: You can also navigate with your arrow keys or swiping.
Metadata
Capture date:
Original Dimensions:
5616w x 3744h - (download 4k)
Usage
storage instrument combined plan sec south 留 battery prim hyperion air ture discharge pumped mins rate control flow document sludge turb hardware eff basin electronics psi channel aaaaaa level sony sluge plant bo sp screen tur nors turbidity system consumer sewer machine pb primary bidity chart total bas monitor computer pressure west percen
Detected Text
0 0.0 10 10.44 100 104 110.0 2.87 20 2009 22 27 323 331 40 453 475.95 5101x443 523 53 5311 60 8.81 80 aaaaaa air basin bidity battery bo channel combined discharge eff instrument mins nors percen plan prim primary rate s101x643 sludge sluge sony sp sewer south storage tur turb turbidity ture total west a bas being control drop225 flow in level of pb plant pressure psi pumped sec system วัน1 留
iso
1600
metering mode
5
aperture
f/2.8
exposure bias
-0.32999999999999996
focal length
70mm
shutter speed
1/50s
camera make
Canon
camera model
lens model
overall
(25.95%)
curation
(25.00%)
highlight visibility
(1.99%)
behavioral
(10.10%)
failure
(-0.37%)
harmonious color
(1.25%)
immersiveness
(0.12%)
interaction
(1.00%)
interesting subject
(-64.75%)
intrusive object presence
(-16.09%)
lively color
(13.72%)
low light
(1.37%)
noise
(-0.81%)
pleasant camera tilt
(-7.10%)
pleasant composition
(-14.60%)
pleasant lighting
(-10.11%)
pleasant pattern
(6.03%)
pleasant perspective
(10.48%)
pleasant post processing
(-0.67%)
pleasant reflection
(-1.40%)
pleasant symmetry
(4.03%)
sharply focused subject
(5.05%)
tastefully blurred
(11.33%)
well chosen subject
(-10.28%)
well framed subject
(54.10%)
well timed shot
(0.22%)
all
(2.31%)
* WARNING: The title and caption of this image were generated by an AI LLM (gpt-3.5-turbo-0301
from
OpenAI)
based on a
BLIP-2 image-to-text labeling, tags,
location,
people
and album metadata from the image and are
potentially inaccurate, often hilariously so. If you'd like me to adjust anything,
just reach out.